We have observed lately an increase of the memory footprint of our production MGM which seems abnormal.
The server has been consuming maximum 380G for about 3 weeks steadily once the namespace cache was full (settings are 250M files and 30M directories). Then as of a sudden, the memory increased up to 530G today, without any change in the cache.
We are planning to restart the daemon in the few days before it reaches the maximum memory. We were wondering if :
reducing the maximum number of cached entries could help in cleaning the memory, or is there something else that could be done to avoid restarting ?
what information could we gather before restart to help understand the reason
The eos server version is 4.4.39, and uses QuarkDB namespace.
Output of eos ns
# ------------------------------------------------------------------------------------
# Namespace Statistics
# ------------------------------------------------------------------------------------
ALL      Files                            806498843 [booted] (0s)
ALL      Directories                      166745512
ALL      Total boot time                  2 s
# ------------------------------------------------------------------------------------
ALL      Replication                      is_master=true master_id=s-jrciprjeop214p.cidsn.jrc.it:1094
# ------------------------------------------------------------------------------------
ALL      files created since boot         254112493
ALL      container created since boot     32992928
# ------------------------------------------------------------------------------------
ALL      current file id                  1277248188
ALL      current container id             247746748
# ------------------------------------------------------------------------------------
ALL      eosxd caps                       21589
ALL      eosxd clients                    67
ALL      eosxd active clients             34
ALL      eosxd locked clients             5
# ------------------------------------------------------------------------------------
ALL      File cache max num               250000000
ALL      File cache occupancy             249649706
ALL      In-flight FileMD                 0
ALL      Container cache max num          30000000
ALL      Container cache occupancy        27808279
ALL      In-flight ContainerMD            1
# ------------------------------------------------------------------------------------
ALL      memory virtual                   705.50 GB
ALL      memory resident                  576.09 GB
ALL      memory share                     11.14 MB
ALL      memory growths                   701.62 GB
ALL      threads                          621
ALL      fds                              1006
ALL      uptime                           4317885
# ------------------------------------------------------------------------------------
ALL      drain info                       thread_pool=central_drain min=80 max=400 size=80 queue_size=0
# ------------------------------------------------------------------------------------
We also found a FST which clearly seems to have memory leak (memory rss increases steadily since several weeks up to 93GB vs only 4GB for other FSTs). I would have the same question as above about what information can be gather before restarting it that coudl be useful ? (stacktrace, etc…) version is quite old 4.4.23.
@esindril one thing I wanted to tell you this morning but I couldn’t, is that on the MGM, we tried to slightly lower the number of maximum entries in the cache, this temporarily freed some memory, but the memory consumption still goes on increasing to a level higher than before this lowering. It might be normal that the memory consumption is not directly linked to the number of entries in the cache. If yes, could it be the solution to go one lowering this maximum ?
Sounds like some particular operation / workflow in the MGM is causing a memory leak. Perhaps a user started using it heavily during recent days inside some script, causing memory consumption to increase sharply.
Maybe “eos ns stat” could help determine which operation, or user, this could be coming from?
Because you are right, once the MGM reaches its maximum cache capacity memory consumption should stay more-or-less constant – suddenly going from 380G to 530G is not normal.
With some hesitation, I would say this issue looks similar to one we’ve seen at CERN: EOS-3755
Moreover, it’s normal and expected that memory consumption temporarily goes down after a decrease of the cache size. Since the likely root cause of the issue is a memory leak though, decreasing the cache size just postpones the inevitable OOM.
We have been trying to find from the eos log files or statistics metrics if we could find some correlation, but nothing was really clear. We would need to interview the users to know if someone is doing something unusual.
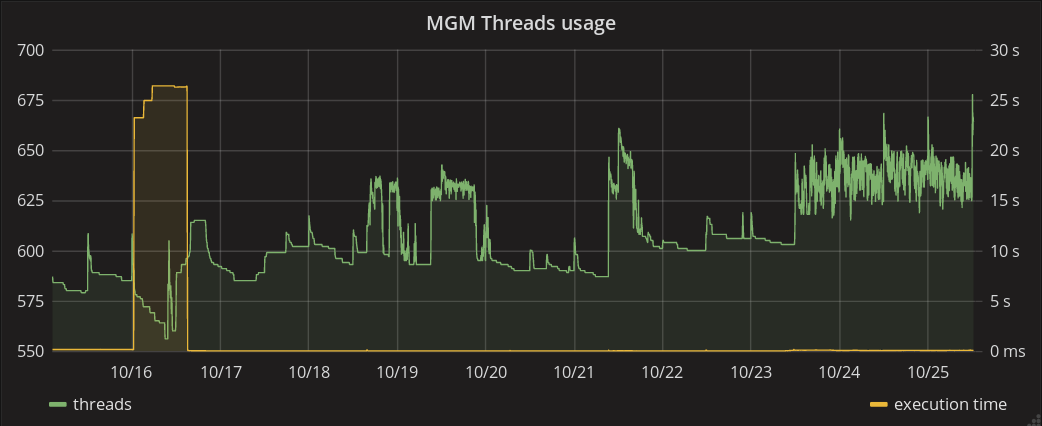
Here are some observations though. Difficult to decide if this is linked to the issue.
some hours before memory increase, we had a increase of total file open for read (up to 20K). After some hours, open files number dropped again, but the memory went on increasing.
After the first memory increase, the consumption had a drop. Just at that time, the execution time reported by ns stat when to 25s (seconds) for about one day.
I have some other observations. We started again to reduce the cache size. Progressively, and always to a value higher than the current cache occupancy.
when reducing the file cache size, the cache empties by chunk, which frees memory. What is noticeable is that this increases the difference between maximum and current use. E.g. the maximum was 240M, and usage 227M. After reducing it to 230M then 225M, the usage went down to 204M. As if it were freeing more than necessary. It might be normal, just to notify.
when reducing the directories cache size, the cache occupancy also reduces like the files (by more than what we reduced the maximum) but no memory was freed.
Could the memory leak come from there ? I find it quite unlikely, but if yes, what could have happened is users starting to read folders that were untouched for a long time, filling the cache, but memory not being freed. This could be corroborated by the logs of the QuarkDB server : starting the time of the memory leak, the reading rate is more or leass steady around 1KHz. Before that it was under 100Hz.
PS : Here are the graphs I’m talking about, during the last 10 days, to illustrate :
That’s very interesting. Is it still at a consistent 1kHz? If so, would you mind sending me a trace of MONITOR for a few seconds? (redis-cli -p 7777 MONITOR)
This will help determine which thread exactly is issuing so many reads.
The memory went on increasing erratically (a lot for some hours, more steadily othertimes, but also decreasing periods). The cache size had to be reduced up to 170M files and 21M directories to keep the memory consumption under control. The memory cleaning after cache reduction is not always immediate, so it is difficult to understand if the memory decrease we observed are linked to this or to something else.
We planned to restart the MGM daemon tomorrow afternoon. If you think of something we could check on the instance before the restart, please let us know before then. The QuarkDB read rate is always steady, around 2kHz.
Sounds like a good plan. Unfortunately I wasn’t able to determine the cause of the memory leak based on MONITOR output. Let’s see if the next reboot improves things.
We have some interesting news, and it could well be a confirmation that there is no memory leak. Here are the details :
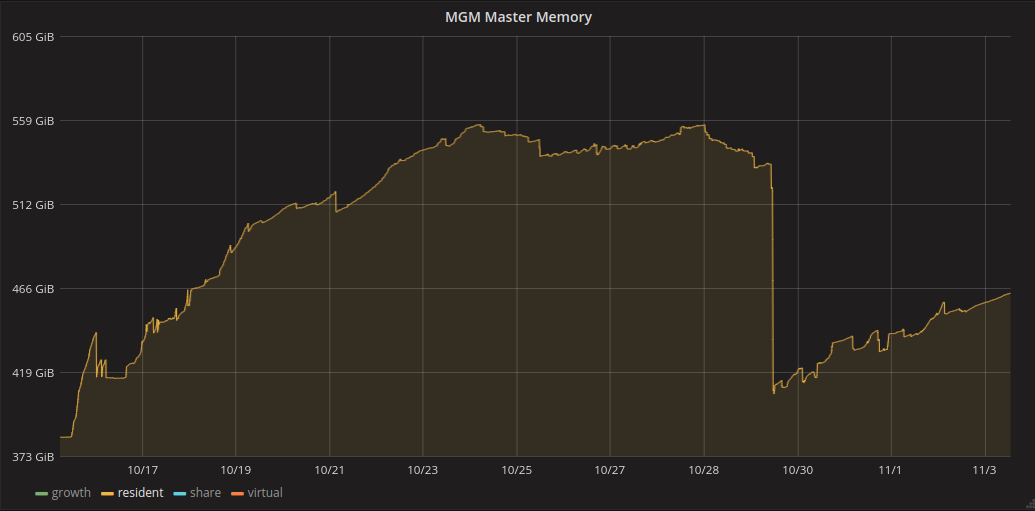
This morning the MGM de-allocated (i.e. freed) around 150GB of memory. At the same time, the execution time went up to 3 minutes, which made us easily understand that a find command had just finished (Find average time was millions of milliseconds). So what I think is that a find command on a very large part of the namespace (many million files) was launched, and lasted for 15 days, allocating the necessary memory for the response. This can also explain the high rate read on the QuarkDB cluster. This rate indeed drop at the same time; even if the instance still has some activity, it seems that the read rate was due to this
Could you confirm that this explanation is plausible ? If yes, we might avoid the daemon restart this afternoon (and we were lucky to wait enough to understand that).
One small doubt we have is that the memory consumption hasn’t reach back exactly the same level as when it started increasing, but is around 30GB more, even if the cache size was reduced. But this is still acceptable for the available memory we have (still around 200GB).
Another thing : 15 days for a find, even on the whole namespace (currently 800M files 165M directories), seems quite long, or is it what we should expect ?
I suppose that there is no way to detect if an expensive find command is still currently running, and, ideally, to force stop it ?
Interesting update! The find command should normally write the results into a temporary file, and then stream that which avoids a huge increase in memory. I’m not entirely familiar with that code, there might be a case in which the temporary file is not created, so this scenario is plausible.
There should be something in the log whenever a find command starts, does it correlate with when memory consumption started increasing? You could find the exact time in QDB when read rate went to 2 kHz sustained, and search for a find command in the MGM around that time.
Thank you for your answer, sorry I couldn’t write earlier.
No we do not have the line in the log file for the find command. We filtered out the open function from the logs because it is causing too many log lines, and it seems that the find trace is inside that function. But from the history of the MGM, we could find that the find command was run at that time.
That stream from a file, maybe it is linked to a new implementation of the find command that is not yet released in out version (4.4.39) ?
One bad piece of news is that during the last days, the memory went on increasing (almost half of was was freed next week is used again), still without any logical explanation. We didn’t increase back the cache, and we suppose that this time there is no find running… Still monitoring it to understand if this is to be worried about…
The uptime of the MGM is currently 9 weeks, we never ran the daemon with QDB namespace that long until now. Are there reason of memory usage other than the namespace cache, that could use this memory ?
By the way, I don’t have access to issue EOS-3755 that you mentioned, could it be of some help ?
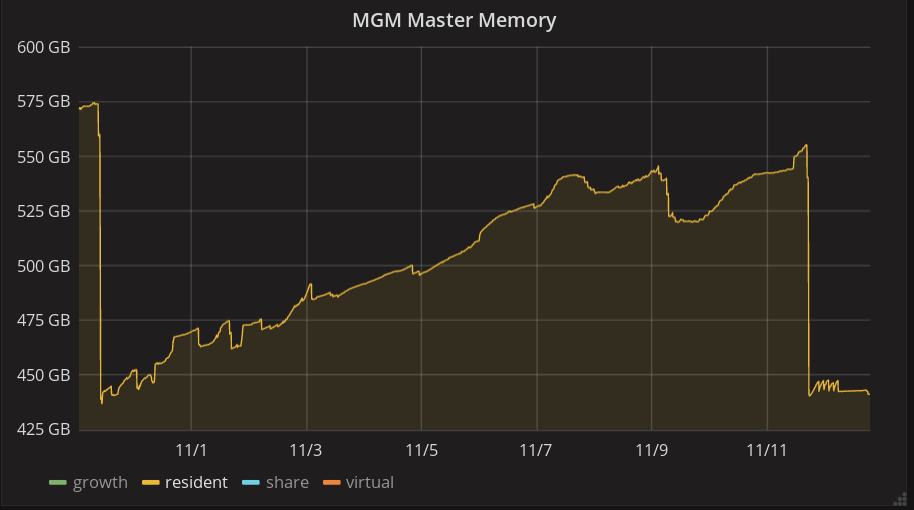
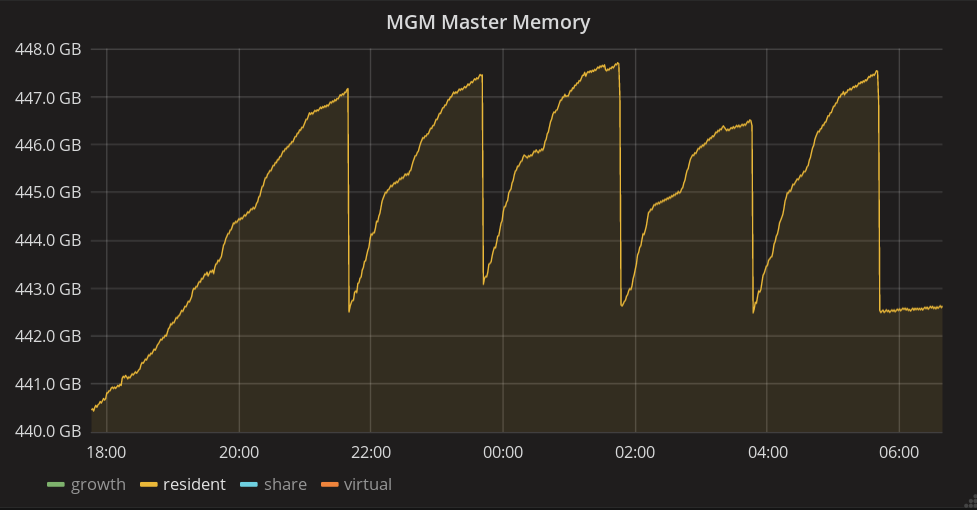
The find operation (from the MGM, i.e. without any limit for the results) seems to be also the cause of the second memory increase, indeed we had another memory consumption drop after 15 days. However, we have the feeling that the find operations were all run at the same time from the command line, but performed by the MGM one after the others. Indeed, on the below graphs, the five small hills we can see after the second drop were run during the night (no one is acting at that time), and also correspond to some find commands that run for just few hours. Is there somewhere a queue mechanism that could explain that ?
But we can confirm that we now have a steady memory consumption for several days.